Why GDP is so misleading? 為什麼GDP如此具有誤導性?
https://www.tiktok.com/t/ZP8tH18h4/
https://m.facebook.com/story.php?story_fbid=pfbid02NJD3ihVuyLyvF72ZXc88meoAKSj4bm9QEgDfmJtcjPMgxidtugJ7F9hZrGyhw4Rpl&id=100036400039778&mibextid=wwXIfr
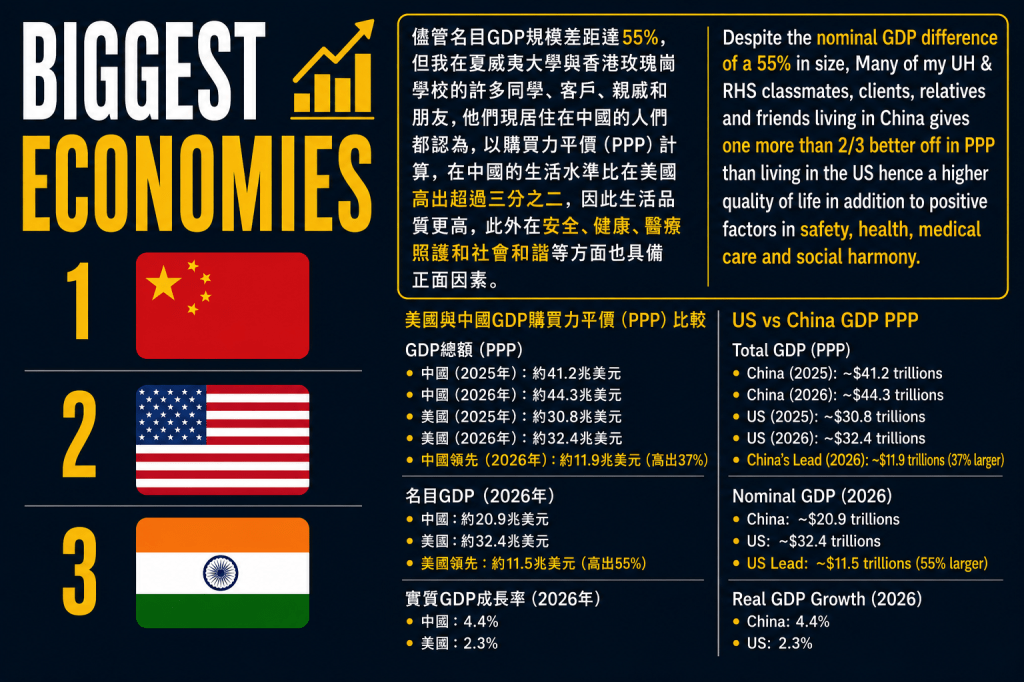
Despite the nominal GDP difference of a 55% in size, Many of my UH & RHS classmates, clients, relatives and friends living in China gives one more than 2/3 better off in PPP than living in the US hence a higher quality of life in addition to positive factors in safety, health, medical care and social harmony. 儘管名目GDP規模差距達55%,但我在夏威夷大學與香港玫瑰崗學校的許多同學、客戶、親戚和朋友,他們現居住在中國的人們都認為,以購買力平價(PPP)計算,在中國的生活水準比在美國高出超過三分之二,因此生活品質更高,此外在安全、健康、醫療照護和社會和諧等方面也具備正面因素。
US vs China GDP PPP
Total GDP (PPP)
- China (2025): ~$41.2 trillions
- China (2026): ~$44.3 trillions
- US (2025): ~$30.8 trillions
- US (2026): ~$32.4 trillions
- China’s Lead (2026): ~$11.9 trillions (37% larger)
Nominal GDP (2026)
- China: ~$20.9 trillions
- US: ~$32.4 trillions
- US Lead: ~$11.5 trillions (55% larger)
Real GDP Growth (2026) - China: 4.4%
- US: 2.3%
美國與中國GDP購買力平價(PPP)比較
GDP總額(PPP)
- 中國(2025年):約41.2兆美元
- 中國(2026年):約44.3兆美元
- 美國(2025年):約30.8兆美元
- 美國(2026年):約32.4兆美元
- 中國領先(2026年):約11.9兆美元(高出37%)
名目GDP(2026年)
- 中國:約20.9兆美元
- 美國:約32.4兆美元
- 美國領先:約11.5兆美元(高出55%)
實質GDP成長率(2026年)
- 中國:4.4%
- 美國:2.3%